Quantcast
Channel: SCN : Blog List - SAP HANA Developer Center
Viewing all 676 articles
Browse latest View live

Experiences with SAP HANA Geo-Spatial Features – Part 2

$
0
0

Welcome to Part 2 of my blog on Experiences with SAP HANA Geo-Spatial Features. You can see how I created my Geospatial data set for my application in the PART1 of my blog.


In this part I will show how the data was exposed from HANA as GeoJson using XSJS and its consumption by Leaflet Map Client.


The application basically supports 2 features:-

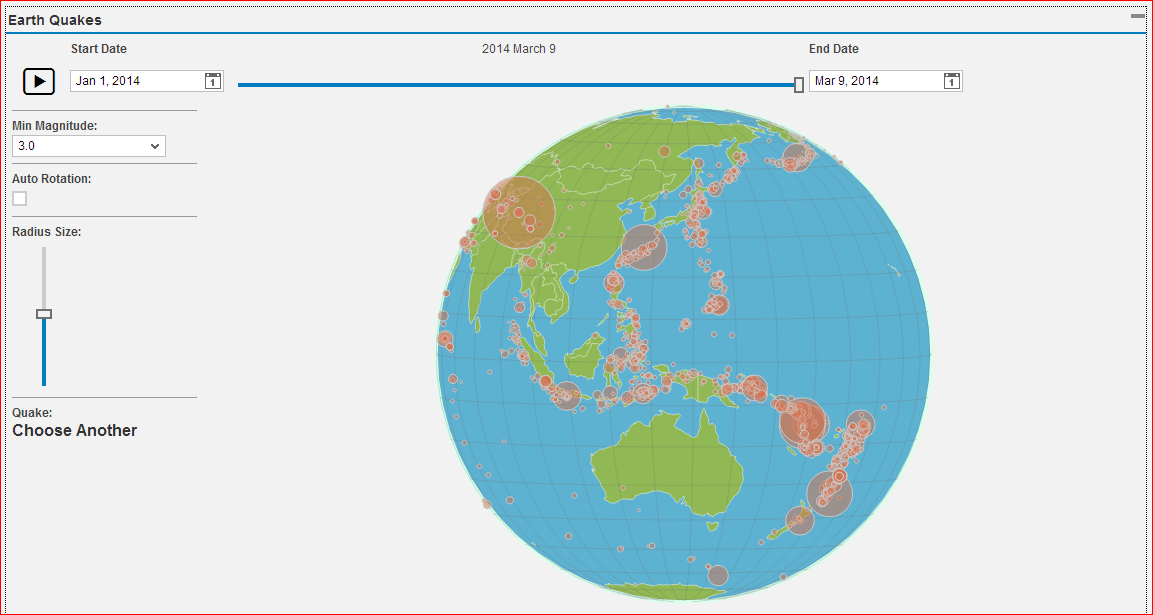
  1. It displays all the parliamentary constituencies and on hovering on each of the constituency you can see more details about the constituency.
  2. You can draw a polygon or a rectangle in the MAP around the constituencies and you will get the number of seats won by each party for constituencies which comes within the area of the polygon or the rectangle.


I have created 2 XSJS service for each of the above 2 features.

For the 1st feature I am selecting the constituency information along with the shape information and returning the data in GeoJson format.

The ST_AsGeoJson() is a function provided by HANA Geospatial which can be used to return the data in GeoJson format. I am fetching the data in this format and adding it to a FeatureCollection as you can see below.

pic3.png

The results return by this service is show below:-

result1.PNG


You can add as many features(like ST_NAME, color) you want under the feature collection but the shape will be stored under the geometry section of each feature as seen above.


The second XSJS service will be triggered whenever you draw a polygon on the MAP. I get the polygon co-ordinates using the MAP APIs and call the service by passing them as input. Inside the service i try to fetch all the constituencies which lies within the polygon by using the Geo-Spatial Function ST_Within() as shown below.


pic4.png

The results returned from this service will look like as shown below.

result2.PNG

I am consuming the data returned from the XSJS service in my HTML5 application using AJAX. I used Leaflet.js APIs to plot and display the MAP.

More information on Leaflet can be found in the links http://leafletjs.com/.


It is done by following the below steps:-

Step 1 :- In Leaflet.js you need to first create a MAP instance and linked it to your map div.

               var map = L.map('map', {

                 zoomControl : true

               }).setView([ 22.527636, 78.832675 ], 4);


Step 2:- You need to add the tile layer to the map. The tile can be of anything as leaflet is open source. It can be of Openstreetmap as well as Cloudmade. I
             used cloudmade(http://cloudmade.com/) in my example.


Step 3:-  The you can do a AJAX call to get the constituencies data in the form of GeoJson and add it to the map.

               function querystates(statesData){

                 $.ajax({

                 url: '../model/geodata.xsjs',

                 data: statesData,

                success: function (statesData) {

                 $('#wrapper').hide();

                 geojson = L.geoJson(statesData, {

                 style : style,

                 onEachFeature : onEachFeature

                 }).addTo(map);

                 }

                 });

}


Step 4:-   On Each Feature which is nothing but a constituency you can perform further actions on mouseover, mouseout etc.

               function onEachFeature(feature, layer) {

                 layer.on({

                 mouseover : highlightFeature,

                 mouseout : resetHighlight,

                 click : zoomToFeature

                 });

                 }


And that`s it the application is up and running. For drawing shapes on MAP we need to use Leaflet Draw APIs which can be found in the link Leaflet/Leaflet.draw · GitHub.


You can also find the entire code for HTML 5 UI as well as the XSJS in the GITHUB link stated here:- https://github.com/trinoy/gisdemo.

where in you can see how i am using the Leaflet Draw APIs to create the shapes. The main file for drawing the MAP is map.js which is available under the UI/JS folder.


That`s all for now. If i try something new will definitely write some more blogs. hope you liked it.


Experiences with SAP HANA Geo-Spatial Features – Part 1

$
0
0

SAP HANA Geospatial processing feature was launched with SAP HANA SP6. As a developer I had no idea even what spatial processing meant but with the help of the content available over SCN and doing some hand-on as a part of SAP Blue Project I have come up with a small demo of an application which highlights some of the geospatial features.


The demo will look as shown below:-

main1.png


The blog will be divided into 2 parts where-in I will try to highlight how the application was created from an end to end perspective.


In Part 1(current document) I will explain some of the geospatial features available in SAP HANA and how we can write logic to store and access such data. I will also show what data was used in my application.

In PART 2 of this blog I will show you details on how geospatial information can be access via XSJS as GeoJson and how can we integrate Leaflet MAP client to display the data.


So to start SAP HANA has brought in some new spatial data types like POINT (ST_POINT) and Geometry (ST_GEOMETRY) to store spatial information. A point is like a fixed single location in space and will be represented by X and Y co-ordinates (*can also have a Z co-ordinate in case of 3D space).

A Geometry is like a super class container and can store the below type within it.

pic1.jpg

Below you can see how we can store and retrieve data from a Point or Geometry Type

Point

Geometry

SETSCHEMA"DEMO_SPA";


create column table spatial_point

(

point ST_POINT

);


insert into spatial_point values (new ST_POINT(0.0, 0.0));


select point.ST_AsGeoJSON()from spatial_point;


Output:-

SETSCHEMA"DEMO_SPA";


create column table spatial_geom

(

shape ST_GEOMETRY

);


insert into spatial_geom values (new ST_POINT(0.0, 0.0) );


insert into spatial_geom values (new ST_POLYGON('POLYGON((0.0 0.0, 4.0 0.0, 2.0 2.0, 0.0 0.0))') );


select shape.ST_AsGeoJSON() from spatial_geom;


Output:-


So basically in a Geometry data type we can store any of the child types like Line, Polygon or Point. You can also see that we are querying the data as GeoJson which is a special JSON format for encoding a variety of geometrical data structures and it is easily understood by most of the MAP client APIs. More information about GeoJson can be found below here: - http://geojson.org/.


SAP HANA also provides a list of other means to extract data from geometrical data structures apart from GeoJson like Well Known Text (WKT), Well Known Binary (EKB) etc. More information is available in the HANA SPATIAL reference found in the link below:-
http://help.sap.com/hana_platform#section7


Now coming to the application where-in I am showing all the parliamentary constituencies of India (*Note: The data regarding the parties ruling the constituencies might not be accurate as the data was collected was from 2009 and it might have changed over time)

So first I had to collect the shape files for all the constituencies of INDIA. Finally after some amount of research here and there I finally got the data of the Indian parliamentary constituency. You can find the same in this link https://drive.google.com/folderview?id=0B3zSndF4HyuLVG43NUJrUHlCLTQ&usp=sharing.


The data was in ESRI shape file format (http://en.wikipedia.org/wiki/Shapefile) and luckily SAP HANA supported the shape file import into it.

So in order to load shape file into HANA you need to perform the 4 simple steps stated below:-

  1. Download Putty(http://www.putty.org/) and PSCP(http://www.nber.org/pscp.html)
  2. Copy the shape file(zip it first) from your local machine into HANA using PSCP
    C:\<path to PSCP directory>>pscp.exe  <source file> <OS_Username>@<HANA _server name>:<destination folder>
  3. You can login to you server using putty and unzip the files.
  4. You can import the shape files in HANA by running the below command

        IMPORT "Schema_Name"."Table_Name" AS SHAPEFILE FROM 'path to shape file’
        Note: Don’t give the extension of the shape file in the path. Just mention its name.


So once I imported my shape files into HANA, the data looked like below:-
pic11.png


So as you can see I had the list of all the constituencies along with the following information:-

  1. The state to which it belong, the ruling party, area and the color code(some of the fields were added later)
  2. The shape information.


I can also see the shape as GeoJson and the data looked like as shown below.

pic2.png


So you can see that most of the shape are really complex and are created using polygons and multipolygons with a large number of points.

In the next part of this blog, I will explain how we can expose the data out of HANA as a XSJS service and how we can visualize the data using LEAFLET.

HP 3PAR StoreServ Certified for SAP HANA Tailored Data Center Integration

$
0
0

HP 3PAR StoreServ now certified for SAP HANA Tailored Data Center Integration


By Hasmig Samurkashian, HP Storage Solutions Marketing


We are pleased to announce HP 3PAR StoreServ certification for SAP HANA Tailored Data center Integration (TDI).  While we believe that HP ConvergedSystem for SAP HANA is unbeatable as a complete solution, TDI does offer you some additional flexibility for. Here’s how we see it when it comes to HP ConvergedSystem for SAP HANA advantages and SAP HANA TDI offerings.


We’ve remained committed to delivering SAP HANA solutions to our customers since 2011, gaining momentum as we go. Today, we offer a broad set of highly scalable offerings for SAP HANA and are support the converged system model for SAP HANA.


Now we are pleased to announce HP 3PAR StoreServ certification for SAP HANA Tailored Data center Integration (TDI).  While we believe that HP ConvergedSystem for SAP HANA is unbeatable as a complete solution, TDI does offer you some additional flexibility for. Here’s how we see it:


HP ConvergedSystem for SAP HANA advantages-

  • Single vendor offering for SAP HANA
  • Highest quality and performance
  • Fastest time to implementation
  • Single point of contact for support


SAP HANA TDI offerings-

  • Flexibility– so you can choose a storage component independent of other solution components
  • Cost– giving you the ability to leverage existing storage investment


The 3PAR StoreServ advantage


HP 3PAR StoreServ is an ideal platform for HP ConvergedSystem for SAP HANA and for TDI environments.  For database environments, StoreServ offers ease of management and advanced thin provisioning, plus superior performance and availability. Plus, StoreServ is one of the fastest growing products in HP Enterprise Group history, gaining 3,400 new customers in 2013.


Certification for SAP HANA TDI completes the 3PAR offering for SAP HANA


Not only is 3PAR integrated in our premier scale-out offering, AppSystem 1.2 for SAP HANA but 3PAR can now be the storage of choice for customers and service providers who have chosen to implement SAP HANA TDI.  


HP 3PAR offers unique benefits for TDI environments:


  • ASIC-based performance optimization
    including wide striping plus mixed workload support allowing a single class of
    drives to be optimized for random and sequential access
  • Quality of service including Priority
    Optimization for multi-tenant SAP HANA and non-SAP HANA workloads1
  • Highly available architecture with multi-controller
    resiliency to keep SAP HANA up and running
  • Self-configuring, self-provisioning
    and optimization through autonomic management
  • Federation technologies with HP Peer
    Motion to allow seamless growth and migration of data in an SAP HANA environment


SAP HANA TDI services too

In addition, HP Technology Services Consulting has developed a portfolio of services to help you implement TDI.  These services are key to enabling proper design, implementation and certification of SAP HANA TDI environments. 


We’re not stopping here

We are looking forward to another year of growth in SAP HANA opportunities. We will continue to bring our vast knowledge and resources to bear to ring you the best SAP HANA solutions.


Ready to learn more?


HP Solutions for SAP HANA
– with more info on HP Converged System for SAP HANA and 3PAR certification for SAP HANA TDI


HP 3PAR StoreServ Storage


HP Storage for SAP environments


1 Multi-tenant support requires 3PAR 10800 with 6 or more controllers

Using HADOOP PIG to feed HANA Deltas

$
0
0

I think I've read somewhere recently that HADOOP is considered by some as a Swiss Army Knife for solving Big Data problems.


It certainly has a large plethora of tools, at various levels of maturity.

It's amazing the speed at which these opensource tools are developing and evolving.


If I needed to prepare external data files for HANA my first thought would be Excel.

As the size of the data and frequency of loading increased I might start thinking SAP DataServices (BODS).


There's usually more than one way to crack an egg though so my next thought is to consider using HADOOP.


The following diagram illustrates just a few of HADOOPs tools:


In this blog I will primarily explore the use of  PIG, SQOOP and OOZIE to insert delta records into HANA. [ b)  & c) ]


For more details on using SQOOP & OOZIE with HANA see:

Exporting and Importing DATA to HANA with HADOOP SQOOP

Creating a HANA Workflow using HADOOP Oozie


For a great intro to Hadoop (including PIG) then try out the Hortonworks Sandbox and follow some of their useful tutorials (Hadoop Tutorial: How to Process Data with Pig)


I don't want to reinvent the wheel completely so please do check out the Hortonworks tutorials.  They also have videos  if you don't want to get your hands dirty.


Below I will briefly cover 3 scenarios:

A) Manually using PIG to reformat a file

B) Using PIG to compare files and generate a DELTA file

C) Use Ooozie, Pig & Sqoop to transfer Delta to HANA


Manually using PIG to reformat a file

1) Load your raw file using the  HADOOP User interface (HUE)

NOTE: PIG can also be used with some compressed file formats as well.


2) Run a Pig Script to FILTER and Remove some columns


End result


Using PIG to compare 2 files and generate a basic DELTA file


In this example I will load a new file and compare with the above file.  Where I have a new key (ID)  I want to generate a new DELTA file with only the new key records.

The new file is:

Note from above we have previous received record with ID 3, so the new delta record should only be (4,dddd)


So lets use a PIG script to determine the simple DELTA

If you look closely at the logic it  resemble a Right Outer Join where the key of Left table is NULL.


The end result is:


Finally lets combine this PIG Script with HADOOP OOZIE & SQOOP to schedule and load the DELTA to HANA.


Use Ooozie, Pig & Sqoop to transfer Delta to HANA


Prior to running a new OOZIE workflow, lets check the target table which I manually loaded with results of the first simple PIG script.


Now lets create & run an Oozie workflow as follows:


Step1 - Use a Pig Script to create Delta File

NOTE: This will execute the same script used earlier.


Step 2 - Use Sqoop to export Delta File to HANA


Step3 - Move the New Delta and Overwrite the previous Delta


Now lets execute the workflow and see the results


Now finally lets check if it made it too HANA.


SUCCESS 


If you give it a try then please do let me know how you get on.


Using PMML Model as Input to a AFL Wrapper Generated PAL Function

$
0
0

This blog page discusses how to use a PMML model exported from SAP Predictive Analysis or from some PAL functions via a stored procedure generated by afl_wrapper_generator for a PAL function. We will use multiple linear regression (MLR) as the driver for this topic.


Walk Through


It does appear that some PAL functions can export PMML according to SAP HANA Predictive Analysis Library PAL Reference.  Using this reference, we can see that SAP Predictive Analysis is using LRREGRESSION as the PAL function to train MLR against. Then when we export the model as a stored procedure, we get a wrapper stored procedure that calls the FORECASTWITHLR generated stored procedure (ie, maybe called something like _SYS_AFL.I838604_PAS00AMYWGCT0Y_ZE4LISJ2MWMY_MLR_PMML_FORECASTWITHLR). By default, the stored procedure that is generated is set up to deal with a coefficient input table; however, we can see from the aforementioned reference, that there is an alternative option:


pal-input-table.png

From the above picture, we can see that second input table for FORECASTWITHLR can take a PMML model as an input for the coefficient input table. Also, the third input table, would need to be changed to set the MODEL_FORMAT row equal to "1" to tell it to use a PMML model.

pal-mlr-parameter-input-table.png

These differences mean we need to regenerate the stored procedure to the PAL FORECASTWITHLR function unfortunately. Thus, this means using the stored procedure generated by SAP Predictive Analysis will do us no good if we want to use a PMML model. In other words, we must manually run SQL to get to the point of using afl_wrapper_generator.


The following is the SQL that I have used to test this, which is mostly self contained. Make sure your user has appropriate privileges (ie, see Error: Insufficient privilege). One of the main changes to use the PMML is to change the second input table's second column to a VARCHAR (5000) column (a CLOB is an option as well, though SAP Predictive Analysis has an NCLOB used by the output table type).


/*
 * Create wrapper procedure for PAL's FORECASTWITHLR function.
 */
/* CREATE TABLE TYPE FOR MY INPUT DATA */
DROP TYPE PAL_DATA_INP_T;
CREATE TYPE PAL_DATA_INP_T AS TABLE(
"row_id" INT,
"CONSENSUS_QTY_DBL" DOUBLE
);
/* CREATE TABLE TYPE FOR COEFFICIENT INPUT */ 
DROP TYPE PAL_COEFFICIENT_INP_T;
CREATE TYPE PAL_COEFFICIENT_INP_T AS TABLE(
"row_id" INT,
"Pmml" VARCHAR (5000)
);
/* CREATE TABLE TYPE FOR THE TABLE THAT WILL CONTAIN THE INPUT PARAMETERS */
DROP TYPE PAL_CONTROL_T;
CREATE TYPE PAL_CONTROL_T AS TABLE(
"Name" VARCHAR (50),
"intArgs" INTEGER,
"doubleArgs" DOUBLE,
"strArgs" VARCHAR (100)
);
/* CREATE TABLE TYPE FOR THE OUTPUT TABLE */
DROP TYPE PAL_RESULT_T;
CREATE TYPE PAL_RESULT_T AS TABLE(
"row_id" INTEGER,
"PredictedValues" DOUBLE
);
/* CREATE TABLE THAT WILL POINT TO THE DIFFERENT TYPES I'M USING TO RUN THE ALGORITHM */
DROP TABLE PDATA;
CREATE COLUMN TABLE PDATA(
"ID" INT,
"TYPENAME" VARCHAR(100),
"DIRECTION" VARCHAR(100) );
/* FILL THE TABLE */
INSERT INTO PDATA VALUES (1, 'I838604.PAL_DATA_INP_T', 'in');
INSERT INTO PDATA VALUES (2, 'I838604.PAL_COEFFICIENT_INP_T', 'in');
INSERT INTO PDATA VALUES (3, 'I838604.PAL_CONTROL_T', 'in');
INSERT INTO PDATA VALUES (4, 'I838604.PAL_RESULT_T', 'out');
/* GENERATE THE Multiple Linear Regression PROCEDURE */
/* Grant SELECT */
GRANT SELECT ON I838604.PDATA TO SYSTEM;
/* Generate PROCEDURE */
call SYSTEM.afl_wrapper_eraser('PAL_MLR_PMML_PROC');
call SYSTEM.afl_wrapper_generator('PAL_MLR_PMML_PROC', 'AFLPAL', 'FORECASTWITHLR', PDATA);
--------------------------------------------------------------------------------------
/* 
 * Use the newly created stored procedure 
 */
DROP TABLE coef_input_table_1;
CREATE COLUMN TABLE coef_input_table_1("row_id" Integer, "Pmml" VARCHAR (5000));
insert into coef_input_table_1 values (0, null);
update coef_input_table_1 set "Pmml" = 
'<PMML version="4.0" xmlns="http://www.dmg.org/PMML-4_0" xmlns:xsi="http://www.w3.org/2001/XMLSchema-instance" ><Header copyright="SAP" ><Application name="PAL" version="1.0" /></Header><DataDictionary numberOfFields="2" ><DataField name="SALES_FORECAST_QTY_DBL" optype="continuous" dataType="double" /><DataField name="CONSENSUS_QTY_DBL" optype="continuous" dataType="double" /></DataDictionary><RegressionModel modelName="Instance for regression" functionName="regression" algorithmName="LinearRegression" targetFieldName="SALES_FORECAST_QTY_DBL" ><MiningSchema><MiningField name="SALES_FORECAST_QTY_DBL" usageType="predicted" /><MiningField name="CONSENSUS_QTY_DBL" usageType="active" /></MiningSchema><ModelExplanation><PredictiveModelQuality targetField="SALES_FORECAST_QTY_DBL" dataUsage="training" r-squared="0.00788359" ></PredictiveModelQuality></ModelExplanation><RegressionTable intercept="1329.88"><NumericPredictor name="CONSENSUS_QTY_DBL" exponent="1" coefficient="-0.0834675"/></RegressionTable></RegressionModel></PMML>'
;
select * from coef_input_table_1;
drop table control_input_table_1;
CREATE COLUMN TABLE control_input_table_1("Name" VARCHAR (50),
"intArgs" INTEGER,
"doubleArgs" DOUBLE,
"strArgs" VARCHAR (100)
);
insert into control_input_table_1 ("Name", "intArgs") values ('THREAD_NUMBER', 1);
insert into control_input_table_1 ("Name", "intArgs") values ('MODEL_FORMAT', 1); -- set to 1 for PMML
select * from control_input_table_1;
/* CREATE TABLE TYPE FOR MY INPUT DATA */
DROP TYPE PAL_WRAPPER_DATA_INP_T;
CREATE TYPE PAL_WRAPPER_DATA_INP_T AS TABLE(
"CONSENSUS_QTY_DBL" DOUBLE
);
/* CREATE TABLE TYPE FOR THE OUTPUT TABLE */
DROP TYPE PAL_WRAPPER_RESULT_T;
CREATE TYPE PAL_WRAPPER_RESULT_T AS TABLE(
"CONSENSUS_QTY_DBL" DOUBLE,
"PredictedValues" DOUBLE
);
drop PROCEDURE "I838604"."MY_PAL_MLR_PMML_WRAPPER";
CREATE PROCEDURE "I838604"."MY_PAL_MLR_PMML_WRAPPER"(IN data "PAL_WRAPPER_DATA_INP_T", OUT result "PAL_WRAPPER_RESULT_T")
 READS SQL DATA AS BEGIN 
 data_inp = CE_PROJECTION(:data,[CE_CALC('rownum()', INTEGER) as "row_id","CONSENSUS_QTY_DBL"]);
 model_tab = CE_COLUMN_TABLE(coef_input_table_1);
 control_tab = CE_COLUMN_TABLE(control_input_table_1);
 call _SYS_AFL.PAL_MLR_PMML_PROC(:data_inp,:model_tab,:control_tab,result_pred);
 result = select "CONSENSUS_QTY_DBL","B"."PredictedValues" from :data_inp as "A" LEFT JOIN :result_pred AS "B" ON "A"."row_id" = "B"."row_id";
END
DROP TABLE my_test_input; 
CREATE COLUMN TABLE my_test_input AS ( select * from "SAPSOPG"."pdmpoc::T66_DATA_SORTED" );
DROP TABLE #wrapper_output_table;
CREATE LOCAL TEMPORARY COLUMN TABLE #wrapper_output_table(CONSENSUS_QTY_DBL Double, PredictedValues Double);
-- Call Stored Procedure Wrapper for the 'FORECASTWITHLR' PAL function stored procedure 
call "I838604"."MY_PAL_MLR_PMML_WRAPPER"(my_test_input, #wrapper_output_table) with OVERVIEW;
select * from #wrapper_output_table;


In short, with the above SQL script, you can modify certain parts of the PMML model (which is XML) to see the results table change:


update coef_input_table_1 set "Pmml" =
'<PMML version="4.0" xmlns="http://www.dmg.org/PMML-4_0" xmlns:xsi="http://www.w3.org/2001/XMLSchema-instance" ><Header copyright="SAP" ><Application name="PAL" version="1.0" /></Header><DataDictionary numberOfFields="2" ><DataField name="SALES_FORECAST_QTY_DBL" optype="continuous" dataType="double" /><DataField name="CONSENSUS_QTY_DBL" optype="continuous" dataType="double" /></DataDictionary><RegressionModel modelName="Instance for regression" functionName="regression" algorithmName="LinearRegression" targetFieldName="SALES_FORECAST_QTY_DBL" ><MiningSchema><MiningField name="SALES_FORECAST_QTY_DBL" usageType="predicted" /><MiningField name="CONSENSUS_QTY_DBL" usageType="active" /></MiningSchema><ModelExplanation><PredictiveModelQuality targetField="SALES_FORECAST_QTY_DBL" dataUsage="training" r-squared="0.00788359" ></PredictiveModelQuality></ModelExplanation><RegressionTable intercept="1329.88"><NumericPredictor name="CONSENSUS_QTY_DBL" exponent="1" coefficient="-0.0834675"/></RegressionTable></RegressionModel></PMML>'
;


So, running the above script as is, would generate output like the following:


trained-output-results.png

Changing the coefficient to coefficient="-0.1834675", yields:


modified-pmml-output-results.png


Functions with PMML Export Option  → Import Option

  • GEOREGRESSION → FORECASTWITHGEOR
  • LNREGRESSION → FORECASTWITHLNR
  • CREATEDT → PREDICTWITHDT
  • CREATEDTWITHCHAID → PREDICTWITHDT
  • EXPREGRESSION → FORECASTWITHEXPR
  • LOGISTICREGRESSION
  • LRREGRESSION → FORECASTWITHLR
  • POLYNOMIALREGRESSION → FORECASTWITHPOLYNOMIALR
  • APRIORIRULE
  • LITEAPRIORIRULE


Functions without PMML EXport

  • KNN
  • NBCTRAIN
  • NBCPREDICT
  • SINGLESMOOTH
  • DOUBLESMOOTH
  • TRIPLESMOOTH


Conclusions

In conclusion, we can see from this blog page that it is possible to use a PMML model against a PAL function. There are some issues however. We would have to regenerate the wrapper stored procedure to the PAL function, so that it knows to use a PMML model and not a straight coefficient (Ai). So, this means we probably wouldn't want to export from SAP Predictive Analysis as a stored procedure if we want to use PMML. We can export as PMML and then we would need to have a script, similar to the one included on this page, to run the afl_wrapper_generator against. We then would need to copy and paste the PMML into the script and make any desired changes to the XML (before or after Copy + Paste). This could be a brittle solution. Of course, exporting a stored procedure from SAP PA is probably not the best option if you are expecting to have multiple end users which may or may not be on the same HANA instances. Using the PMML also self contains the settings needed; however, it may be nice to have a GUI to import, validate and update the database with PMML changes.


References

Points of Contact

Ad-hoc Analysis Comparison with MYSQL & SAP HANA ONE

$
0
0

Ad hocis a Latin phrase meaning "for this”, enhancing little further, it is created or done for little purpose as necessary. Ad hoc analysis is a business intelligence process designed to answer a single, specific business question. The product of ad hoc analysis is typically a statistical model, analytic report, or other type of data summary. Ad hoc analysis may be used to create a report that does not already exist. Sometimes ad-hoc analysis is done on the reports to drill deeper and to make more statistical comparisons to get better insights. Some of the procedure are, interactive querying, ranking, year-over-year analysis etc. Generally Ad-hoc analysis is done by the people, who are non-technical. Queries that executes during ad-hoc analysis are extremely complex, as data is retrieved from multiple tables and data sources.Using an ad hoc query may also have a heavy resource impact depending on the number of variables needed to be answered.

With this preamble, I want to proceed to show the Ad-hoc analysis done using MySQL and SAP Hana one. My main intention is to show, the ease of use of building ad-hoc analysis methodology in sap Hana. Process followed is:-


  • Identified the efashion and club as Retail data set
  • Exported or created the efashion and club Schema and updated the database with the data, in MySQL database.
  • Using the ETL tool, MySQL database is exported to Hana Database.
  • Designed and build the queries that are necessary to execute on MySQL database.
  • Executed the same queries on the Hana database instance.
  • To unleash the true power of Hana, created Attribute Views, Analytical views, Calculation views, procedures and Decision tables.


Explanation of the Database [EFASHION]:-

  • The efashion database is also shipped with this release. This MS Access 2000 database tracks 211 products (663 product color variations), sold over 13 stores (12 US, 1 in Canada), over 3 years.
  • The database contains:
  • A central fact table with 89,000 rows of sales information on a weekly y basis.
  • A second fact table containing promotions.
  • Two aggregate tables which were set up with aggregate navigation.


Picture below show the schema of the Efashion Database.

EfashionSchma.jpg


Mysql is a very popular open source database.Most of the customers,planning to build the low cost solutions primarily use this database.As cost is the primary constarint,many times we need to do our analysis of data without the help of any BI tools.Direct & Quick option is to build queries on Mysql database.Let me show few scenarios build below:-


  • Generate a Report showing the Revenue,Margin,etc based on Year and CITY


Mysql_Query_1.png

  • Consolidate the Data based on the Shop Name,Here we want to see the Revnue based on the Shops

Mysql_Query_2.png

  • Year on Year comparision Query for Revenue, Amount Sold, Quantity Sold & Margin


Mysql_Query_3.png

  • Query used to filter based on the Quarter for the year 2004

Mysql_Query_4.png

  • Year on year comparison based on the city contains character ‘Aus’

Mysql_Query_5.png

  • Getting the name of the store with the highest Margin

Mysql_Query_6.png

By now,we have got the fair idea of the requirements that comes from the day to day business(example took are relatively simple).In most of the cases decision makers are non-technial users.Constraints are: Fair database knowledge is required for the user or need to rely heavily on the expert.Also, Query processing time,as most of the queries are complex SQL queries with Joins,Groupby,Orderby,etc


In my next section of blog,will how we can use SAP hana one to explore the possiblity of doing the ad-hoc analysis.


http://scn.sap.com/community/developer-center/hana/blog/2014/02/27/ad-hoc-analysis-comparison-with-mysql-sap-hana-one--continued

Ad-hoc Analysis Comparison with MYSQL & SAP HANA ONE - Continued

$
0
0

In this section of the blog,will talk about the "Ad-hoc Analysis using SAP Hana one".SAP Hana one is,in memory platform hosted in the Cloud.SAP Hana one offers powerful combination of transactional and analytical processing,Subscription fees are also very low,it starts from $0.99 an hour plus AWS hosting fees


Let's begin!! Prerequisits are:-

  • Export the mysql data to Hana
  • Install SAP Hana studio.


Exporting the MySQL Database to Hana using ETL


1.Use Talend to Sync Data from MySQL to HANA (Part I)

2. Use Talend to Sync Data from MySQL to HANA (Part II)

3. Sync Data from My SQL to HANA DB with Pentaho (Part I)

4. Sync Data from My SQL to HANA DB with Pentaho (Part II)


I am demonstrating two methods that can be used to do the ad-hoc analysis using sap Hana. As mentioned in previous blog, ad-hoc many times or mostly done by the users, they may not be having high technical exposure.


ü Method1:- Executing the existing MySQL queries in sap Hana studio,SQLConsole


SAP Hana is support ANSI standard SQL syntax, already written queries from any other database can be executed seamlessly. Let me execute, couple of queries for demonstration purpose. I am able to execute the same query executed on MySQL without changing the query on SAP Hana. Also we get the advantage of Performance capability of SAP Hana.Constantly I am getting the 4-5 times better performance in the execution time of the queries.


  • Getting the name of the store with the highest Margin using SAP Hana

Hana_Query_1.png

  • Method2:-SAP Hana modeling


Modeling refers to an activity of refining or slicing data in database tables by creating views to depict a business Scenario. The views can be used for reporting and decision making. These views are also known as information views. You can model entities in SAP HANA using the Modeler perspective, which includes graphical data modeling tools that allow you to create and edit data models (content models) and stored procedures. As this is done using GUI, technical expertise to use is very minimal. Once the modelling is done without any one help, anybody can view the data and make more analysis.

In SAP Hana studio, I have created 4 attribute views, 2 Analytic views, 1 calculation view.Hana_modeling_1.png


Attribute View:-


AV_ARTICLE  -- Joined ARTICLE_LOOKUP & ARTICLE_LOOKUP_CRITERIA tables

Hana_modeling_2.png

AV_CALENDAR_YEAR  -- Used table CALENDAR_YEAR_LOOKUP

Hana_modeling_3.png

AV_OUTLET_LOOKUP  -- Table OUTLET_LOOKUP


Hana_modeling_4.png

AV_PROMOTIONS -- Table PROMOTION_LOOKUP

Hana_modeling_5.png

Analytical View:-


ANALYTICAL_VIEW_PROMOTION - Data foundation with product_promotion

Hana_modeling_6.png

ANALYTICAL_VIEW_SALES - Data foundation with SHOP_FACTS

Hana_modeling_7.png


Calculation view:-

CALC_VIEW_SALES_PROMOTION –Joined both Sales and Promotion Analytical views

Hana_modeling_CV.png


Let's do some analysis using the Analytical View Sales:-

  • Right click on ANALYTICAL_VIEW_SALESà”Click on Data Preview” tab.
  • Add Attribute “Shop_Name” to Label Axis.
  • Margin,amount_sold,Quantity_sold to Value Axis
  • Result Window will show the result in Graph,table,Grid and Html format


Hana_modeling_Analysis1.png


Let's filter based on CITY


Hana_modeling_Analysis2.png


For ad-hoc analysis,Drillup,DrillDown,Filters,Aggreation,Sorting etc are the major workflow,all these can be attained by just few clicks in the Studio.


Summary:-

Change is the only constant in the present business scenario. Every detail about the analysis cannot be captured with the formal reporting. Ad-hoc analytics provides insights to the questions that we get based on the day to day needs. In order for doing ad-hoc analytics high proficiency in database and high resource usage to execute those complex queries are constraints. Advantages of using SAP Hana one for Ad-hoc analytics is:-


  • Execution time of the  Queries reduces by 4-5 times in SAP Hana one, compared with MySQL
  • Imperative and Declarative logic in SQLscript have greater capability when compared to MySQL
  • Most importantly, using the GUI of the Hana modeler, even the Beginner can do better analysis using SAP Hana.

HANA and Gateway Productivity Accelerator (GWPA)

$
0
0

Introduction


In this blog I will show you how you can quickly expose HANA views in a SAPUI5 application using Gateway Productivity Accelerator (GWPA).


As I have recently been assessing CRM HANA Live models I decided to use one of these views for demo purposes. CRM HANA Live is an add-on for CRM business suite on HANA. Essentially HANA Live is a set of HANA views for common queries on CRM data e.g. quotes, orders, contracts, opportunities, etc... For more details you can check out the SAP Help portal - https://help.sap.com/saphelp_hba/helpdata/en/e0/f15aececda413185ba76c19afac76d/content.htm?frameset=/en/e0/f15aececda413…


GWPA is an eclipse based tool that allows you to easily consume odata services from Netweaver Gateway or other odata sources and rapidly build applications based on pre-defined templates. See here for more details - SAP NetWeaver Gateway Productivity Accelerator.


Here I will show you how to create a new SAPUI5 template adjusted for HANA based applications so that you can quickly create and deploy applications on HANA based on your HANA model. This is done in a few simple steps:


1) Create an xsodata service to expose the HANA model as odata.

2) Create a new SAPUI5 List/Details template specifically for HANA.

3) Create a new SAPUI5 application based on the new template.


Details


1)  The first step is to expose the HANA model that you want to build your application on.


In HANA Studio:

- Create a new "XS Project".

Pic1.png

Pic2.png


- Create an xsodata file and add the following code:


service
{
"_SYS_BIC"."sap.hba.crm/SalesQuotationHeader" as "QuoteHeader" key ("SalesQuotation");
}

- Add an xsaccess and xsapp file


Pic4.png


- Share the project to the HANA repository and activate it.


- Verify that the service is working by opening the URL to the service in a browser:


Pic5.png


2) The next step is to create a new accelerator template specifically for HANA.


- Install the GWPA as follows:

     Help -> Install New Software

     Add software site as below:


Pic6.png

- For this particular demo we only require the Core tools and HTML5 Toolkit so only need to select the below options:

Pic7.png

Pic8.png

     Hit Next and Finish on the next screen.


- Import the template plugin as follows:


     File -> Import -> Plug-ins and Fragments

Pic9.png

     On next screen leave the default entries and hit next.

Pic10.png

     Search for *html5* to find the html5 plugin.

Pic11.png


     Hit Add to include it in import list.

Pic12.png


     You should now see the html5 toolkit plugin project in your Project Explorer.


- Rename the project by right-clicking on the project and doing:

     Refactor -> Rename


Pic13.png

Pic14.PNG


- Open the plugin.xml file and go to the Extensions tab. Right click on the template which has "SAPUI5 List/Details (starter_application)" as it's child and copy.


Pic15.PNG


     Paste the extension

Pic16.PNG

- Now change the id and the display name for the template so that it will be available in the Starter Application wizard:

Pic17.PNG


- Save your changes as you go along.


- Next step is to change the actual project and code template.


     In the res/UI5BaseTemplate/common folder add an empty .xsapp.vm file to mark the root point in the applications package hierarchy from which content can be exposed.


     Then add an .xsaccess.vm file with the following to expose the content and make the code accessible via HTTP.


{     "exposed" : true
}


     Modify the index.html.vm file change the src to point to "/sap/ui5/1/resources/sap-ui-core.js"


Pic18.PNG


     Your folder structure should look like this.

Pic19.PNG


- Last step is to de-install the original HTML5 Toolkit plugin.


     Go to Help -> About SAP HANA Studio -> Installation Details.


     Select the "Toolkit for HTML5 (GWPA, Developer Edition)" and Uninstall.

Pic20.PNG

     Confirm items to be uninstalled and Finish. You will need to restart the studio.


Note: if you do not uninstall the original plugin then you may run into ClassCastException errors when testing your new plugin template. Thanks to Boris Tsirulnik for helping me figure this out.


3) Now you are all set to test your new template and build a HANA UI5 app.


     Right click on your plugin project and do

     Run As -> Eclipse Application


     This will launch a new HANA Studio window.


     File -> New -> Project


     Under OData Development select "Starter Application Project".


Pic22.PNG

     Enter Project name and HTML5

Pic23.PNG

     You should now see your new template available to select

Pic24.PNG

     Enter the URL for the xsodata service that we defined earlier and hit Go. The service details should appear in window below. Note: you will need to enter your HANA database credentials.

Pic25.PNG

     Optionally update the Page Title for the List page

Pic26.PNG

     Choose the fields that you want to appear on the List page.

pic1.PNG

     Add new page for the Details and select the fields to be displayed on the Details page. Click Finish.

pic2.PNG


- For testing purposes go back to your main HANA Studio application (repository workspaces are set up here) and import the project that you have just created from your runtime-EclipseApplication folder e.g. C:\Users\Administrator\runtime-EclipseApplication.

     File -> Import -> Existing Projects into Workspace


- Share the project to your HANA repository and Activate the project.

     Team -> Share Project

     Select "SAP HANA Repository"

     Select repository workspace and package.

     Team -> Activate


- Now open the URL to the app in a suitable browser (e.g. Chrome).


And there you go.


Here is an IPad view shown in Ripple Emulator (which is really useful Chrome Extension). List is shown initially.

pic3.PNG

You can search for quote or customer

pic4.PNG


Drill into the details.

pic5.PNG


IPhone view - the template could do with being adjusted to handle iPhone responsiveness a bit better e.g. the Details page..

pic9.PNG


The out of the box templates are pretty nice, uses the sap.m UI5 libraries and has standard sap_bluecrystal theme applied but I'm sure most companies would like to develop their own template versions and also other patterns. As you can see once you have your template defined whether for HANA, Netweaver Gateway or otherwise then it can as the name suggests really accelerate your development process.


Note: whilst I have used a CRM HANA Live model here as an example, this could be applied to any HANA model.


SAP is Fast and Fiorious with SAP HANA

$
0
0

Yesterday SAP had a press conference where they announced some interesting things about how SAP HANA can now be consumed in easier and easier ways.


The key drivers for this seemed to be the reduction in price for hardware that will support HANA – this should be no surprise as this is Moore’s Law in action. To help customers appreciate this and keep them informed about pricing trends SAP has created a space on the SAPHANA.com site to show approximate prices for various hardware configurations which you can see here. To give this some perspective, last year I know that a 256Gb machine cost $100,000 this chart show it available for $11,278 !!


Screen Shot 2014-03-06 at 08.32.20.png


Another change is the pricing model for SAP HANA, we didn’t get details, but the idea is to unbundle all the services that come round the SAP HANA DB so that you can build the platform up of the components that add value to your use-case.


I hope that these two coupled together with help to drop the “entry point” for productive HANA to a level where everyone can start to innovate on top of HANA (I guess SAP do too ).


To further reduce friction in the innovation process SAP announced further improvements to the SAP HANA Marketplace so you can either bring your own licence or pay a subscription. The managed hardware with the entry level 128Gb system costing $1,595 and 1TB costing $6,495 per month. The subscription licence with 2 versions of HANA available – base and platform - range from $4,595 (Base/128Gb) to $83,295 (Platform/1TB).


With both SAP River and SAPUI5/OpenUI5 (the special sauce that powers SAP Fiori) available to build apps on top of this platform SAP hope that the SAP HANA Marketplace will soon be full of innovative partner apps for you to download……the information above certainly removes many of the barriers to entry…..only the hard part of actually being innovate is left. As a proof point SAP announced that the start ups that it has been helping round HANA have already generated in excess of $10 Million in revenue.


Well done to Vishal and the team at SAP who are proving that SAP can be Fast and Fiorious. Also congratulations on the Guinness world record for the largest Data Warehouse and 12.1 PB !!


Finally when is "Help Help me HANA" by the Beach Boy going to be number 1 - I couldn't find it on iTunes or YouTube.

HANA SQL Procedure's slow "call process"

$
0
0


We are using HANA version 1.00.70.


I wondering SQL procedure's "call-performance".

Below my test statements.
Test shows that direct insert compared procedure call's insert is about 20 times faster.
HANA insert statement is ~3600; but with procedure call it is only 180!
On standard laptop and SQL Server 2005; both execution takes same time and output is about 1500 events per seconds.


Do you have idea what causes huge difference for executions ?
It looks like HANA makes "execution plans" or something similar everytime procedure has called
(does not have cached plans).


drop table JRE_2.TestLoad;
create column table JRE_2.TestLoad (MyNumber int);

drop procedure JRE_2.MyValueInsert;
create Procedure JRE_2.MyValueInsert(v_MyNumber int)
LANGUAGE SQLSCRIPT
SQL SECURITY INVOKER
AS 
BEGIN
insert into JRE_2.TestLoad (MyNumber) values (v_MyNumber);
END;


drop procedure JRE_2.InsertTest;
create Procedure JRE_2.InsertTest(v_CallProc tinyint)
LANGUAGE SQLSCRIPT
SQL SECURITY INVOKER
AS 
BEGIN

declare lv_StartTime datetime :=now();
declare lv_EndTime datetime;
declare lv_LoopNumber int :=0;
declare lv_MethodUsed varchar(16);

if ifnull(v_CallProc,0) = 0 then
  lv_MethodUsed := 'Insert';
else
  lv_MethodUsed := 'Procedure call';
end if; 

while (lv_LoopNumber <=50000) do
 
  if (lv_MethodUsed = 'Insert') then
   insert into JRE_2.TestLoad (MyNumber) values (lv_LoopNumber);
  else
   call JRE_2.MyValueInsert(lv_LoopNumber);
  end if;
 
  lv_LoopNumber := lv_LoopNumber + 1;

end while;

lv_EndTime := now();

select lv_MethodUsed as InsertMethod, lv_LoopNumber as Cnt, seconds_between(lv_StartTime,lv_EndTime) as Duration, cast(lv_LoopNumber/seconds_between(lv_StartTime,lv_EndTime) as int) as InsertsPerSeconds
from dummy;

END;


/* Tests for insert statement */

drop table JRE_2.TestLoad;
create column table JRE_2.TestLoad (MyNumber int);
call JRE_2.InsertTest(0);


==> Results:
INSERTMETHOD; CNT; DURATION; INSERTSPERSECONDS
Insert;   50001; 13;   3 846
Insert;   50001; 14;   3571


/* Test for procedure calls  */
drop table JRE_2.TestLoad;
create column table JRE_2.TestLoad (MyNumber int);

call JRE_2.InsertTest(1);

==> Results:
INSERTMETHOD; CNT; DURATION; INSERTSPERSECONDS
Procedure call; 50001; 276;  181
Procedure call; 50001; 277;  180

XSOData Service Browser

$
0
0


Introduction

I was recently working on developing a couple of XSOData services for Metric² when I realized that it would be pretty helpful to have a way to develop, test, explore services and queries. I wrote a similar tool for SAP Netweaver Gateway and the iPad a couple years ago, and decided to model it with some similarities, but having the ability to build it directly into HANA using XS, would add some nice integration benefits.


About the App


Some selectable options:


Generated Query:


App Design

I figured I would create the app as a web page (Non-MVC) using some UI5 components, and a small open source JS app from Microsoft called OData Query Browser. Since majority of the work is being done by the external js class, to rewrite it into UI5 MVC seemed like overkill


I also made use of a small class I wrote a while back for the SAP Innojam event called HANATalk. (Its a *very* basic synchronous class for HANA in HTML).


HANA Integration

Scouring the _SYS.REPO Schema I found a list of where all the XS objects reside, and filtered out the XSOData services using this query:


SELECT '/' || REPLACE(package_id, '.', '/') || '/' || object_name || '.xsodata' AS url FROM _SYS_REPO.runtime_objects WHERE object_suffix = 'xsodatart'


Download

You can find the Github source here, or you can download the complete Delivery Unit Package here.


Feedback

As usual, please free to try the app out and let me know what you think and if it could use any improvements.

Feeling the Earth Move with HADOOP & HANA

$
0
0

I've been Inspired by Cloudera's example of using Hadoop to collect & collate seismic information, HANA's recent Geo-spatial improvements, and the geographic mapping capability of Mike Bostocks amazing D3.   


I thought  it would be interesting to combine these powerful tools to make an End to End example using:

1)  Hadoop to collect seismic information

2)  HANA to graphical present the data using HANA XS, SAPUI5  & D3.


The following example was built using a Hortonworks HDP2.0 Cluster & HANA SPS7 both running on AWS.


The final results were as follows:


The controls are provided by SAPUI5, and the rotatable globe is made using D3.  This was developed with approximately 800 lines of code.  See below for full code details.


As a brief example of this in action you can watch this short video:


Before I could present the information I firstly used HADOOP to automate the following:

a)  Collect the data from Earthquake Hazards Program

b)  Reformat the data and determine DELTA's, since the last run.

c)  Export to HANA

d)  Execute a HANA procedure to update Geo-spatial Location information.


Below is diagram of the HADOOP tools I used:


Each of the steps are summarised below.  They where scheduled in one workflow using HADOOP OOZIE.


a) Get DATA:  I used  Cloudera's JAVA example to collect recent seismic info  cloudera/earthquake · GitHub

      Note: I modified Cloudera example slightly in order to get place information relating to the quake.

     AronMacDonald/earthquake · GitHub


      The source data is supplied by the US geographical Survey  Earthquake Archive Search &amp; URL Builder


b) Pig Scripts

          1) Reformat the data into TAB delimited files (easier for importing text to HANA)

          2) Prepare a Delta file, comparing data previously send to HANA with new data

      [Note: for a simplified version of using PIG with HANA see Using HADOOP PIG to feed HANA Deltas]


     The pig scripts I created for this more complex example are available at  AronMacDonald/Quake_PIG · GitHub


c) SQOOP  was used to export the delta records to HANA

      [Note: for an overview of using SQOOP with HANA see Exporting and Importing DATA  to HANA with HADOOP SQOOP]


     The sqoop export statement for this tab delimited file was:

      sqoop export -D sqoop.export.records.per.statement=1 --username SYSTEM --password manager

     --connect jdbc:sap://zz.zz.zz.zzz:30015/ --driver com.sap.db.jdbc.Driver  --table HADOOP.QUAKES

     --input-fields-terminated-by '\t' --export-dir /user/admin/quakes/newDelta


    The target table in HANA is:

create column table quakes (

     time      timestamp,

     latitude  decimal(10,5),

     longitude decimal(10,5),

     depth     decimal(7,4),

     mag       decimal(4,2),

     magType   nvarchar(10),

     nst       integer,

     gap       decimal(7,4),

     dmin      decimal(12,8),

     rms       decimal(7,4),

     net       nvarchar(10),

     id        nvarchar(30),

     updated   timestamp,

     place     nvarchar(150),

     type      nvarchar(50)


);


d) Execute a HANA procedure (from HADOOP) to populate geospatial location information for the new records

      [Note: For a simplified example of calling Hana procedures from HADOOP see Creating a HANA Workflow using HADOOP Oozie]


Geospatial information is stored in the following table in HANA:

create column table quakes_geo (

     id        nvarchar(30),

     location ST_POINT  

);


      In order to populate the locations a Hana procedure (populateQuakeGeo.hdbprocedure) was created which performs the following statement:

   insert into HADOOP.QUAKES_GEO

       (select Q.id, new ST_Point( Q.longitude , Q.latitude ) 

        from HADOOP.QUAKES as Q 

        left outer join HADOOP.QUAKES_GEO as QG

        ON Q.id = QG.id

        where QG.id is null );


Finally an  Oozie workflow was created for the above steps on a Hortonworks HDP 2.0 cluster.

An example of the execution log in the Hadoop User interface (HUE) is:


I then got to work building the HTML5 webpage on HANA XS.

These were the main references I used for building the D3 rotating Globe:

Rotating Orthographic

www.jasondavies.com/maps/rotate/

boydgreenfield.com/quakes/


To serve up the quake information, which can be easily consumed by D3 [geojson], a custom server side Javascript (quakeLocation.xsjs) was created.

The basis of the geojson output was the following statement, which used the SAPUI5 controls for Date range and Quake magnitude:

select Q.id, Q.mag, Q.place, Q.time, QG.location.ST_AsGeoJSON() as "GeoJSON" 

from HADOOP.QUAKES as Q 

left outer join HADOOP.QUAKES_GEO as QG

ON Q.id = QG.id

where QG.id is not null


For a simplified version of Using D3 with HANA , including an example of how to create XSJS geojson, then see Serving up Apples & Pears: Spatial Data and D3


The complete HANA XS Project (including above mentioned XSJS, Prodedure and HTML5 source code) is available to download here:

HadoopQuakes.zip - Google Drive


I hope you found this example interesting and I hope it inspires you to automate your HADOOP HANA workflows with OOZIE, as well as exploring the graphical visualisation capabilities of SAPUI5 & D3.

SAP River App in a Day

$
0
0

The recipe below shows you how to make a one River Application in one day.


Ingredients:

  • 7 x people from companies with ideas for apps
  • 2 x River Developers from SAP Israel (freshly imported)
  • 2 x River Developers (local variety)
  • 1 x HANA box at SP7 running ERP
  • 1 x SAP Mentor
  • Whiteboards / flip charts / pens
  • Coffee / sandwiches and cakes


aind2.png

Method:


  1. Introduce all the ingredients to each other and after some small talk get down to discussing the applications they would like to see created.
  2. For each application idea discuss how that could be achieved with SAP River, considering where the data for the application will be sourced/delivered to SAP River (SAP HANA) platform and the business logic.
  3. Select the application to create based on input from the SAP River developers and the companies, trying to select something that isn’t too hard….but isn’t too easy – we selected Smart Incident Report/Alerting, an application that would tweet patterns it found in incidents reported (e.g lots happening in this location).
  4. Design the first cut of the applications and let the developers get to work.
  5. Whilst the app is cooking, take the time to explore what SAP River is and where it fits with the SAP innovation toolset.
  6. Check on the App every 15-20 minutes with playbacks of the code to the team.
  7. After 2 hours start adding more complex features until everyone feels that they have a great understanding of how SAP River fits together. 


aind.png


Thanks to everyone who took part and I would recommend this recipe to anyone trying to understand SAP River.

HP 3PAR StoreServ Certified for SAP HANA Tailored Data Center Integration

$
0
0

HP 3PAR StoreServ now certified for SAP HANA Tailored Data Center Integration


By Hasmig Samurkashian, HP Storage Solutions Marketing


We are pleased to announce HP 3PAR StoreServ certification for SAP HANA Tailored Data center Integration (TDI).  While we believe that HP ConvergedSystem for SAP HANA is unbeatable as a complete solution, TDI does offer you some additional flexibility for. Here’s how we see it when it comes to HP ConvergedSystem for SAP HANA advantages and SAP HANA TDI offerings.


We’ve remained committed to delivering SAP HANA solutions to our customers since 2011, gaining momentum as we go. Today, we offer a broad set of highly scalable offerings for SAP HANA and are support the converged system model for SAP HANA.


Now we are pleased to announce HP 3PAR StoreServ certification for SAP HANA Tailored Data center Integration (TDI).  While we believe that HP ConvergedSystem for SAP HANA is unbeatable as a complete solution, TDI does offer you some additional flexibility for. Here’s how we see it:


HP ConvergedSystem for SAP HANA advantages-

  • Single vendor offering for SAP HANA
  • Highest quality and performance
  • Fastest time to implementation
  • Single point of contact for support


SAP HANA TDI offerings-

  • Flexibility– so you can choose a storage component independent of other solution components
  • Cost– giving you the ability to leverage existing storage investment


The 3PAR StoreServ advantage


HP 3PAR StoreServ is an ideal platform for HP ConvergedSystem for SAP HANA and for TDI environments.  For database environments, StoreServ offers ease of management and advanced thin provisioning, plus superior performance and availability. Plus, StoreServ is one of the fastest growing products in HP Enterprise Group history, gaining 3,400 new customers in 2013.


Certification for SAP HANA TDI completes the 3PAR offering for SAP HANA


Not only is 3PAR integrated in our premier scale-out offering, AppSystem 1.2 for SAP HANA but 3PAR can now be the storage of choice for customers and service providers who have chosen to implement SAP HANA TDI.  


HP 3PAR offers unique benefits for TDI environments:


  • ASIC-based performance optimization
    including wide striping plus mixed workload support allowing a single class of
    drives to be optimized for random and sequential access
  • Quality of service including Priority
    Optimization for multi-tenant SAP HANA and non-SAP HANA workloads1
  • Highly available architecture with multi-controller
    resiliency to keep SAP HANA up and running
  • Self-configuring, self-provisioning
    and optimization through autonomic management
  • Federation technologies with HP Peer
    Motion to allow seamless growth and migration of data in an SAP HANA environment


SAP HANA TDI services too

In addition, HP Technology Services Consulting has developed a portfolio of services to help you implement TDI.  These services are key to enabling proper design, implementation and certification of SAP HANA TDI environments. 


We’re not stopping here

We are looking forward to another year of growth in SAP HANA opportunities. We will continue to bring our vast knowledge and resources to bear to ring you the best SAP HANA solutions.


Ready to learn more?


HP Solutions for SAP HANA
– with more info on HP Converged System for SAP HANA and 3PAR certification for SAP HANA TDI


HP 3PAR StoreServ Storage


HP Storage for SAP environments


1 Multi-tenant support requires 3PAR 10800 with 6 or more controllers

Clone DB HANA and Crystal Report reports for SAP HANA

$
0
0

Dear SAP


Could you please help us with these very urgent questions?


1.    1. Can SAP HANA system be cloned?

    What is the process and method of cloning database of SAP HANA?


2.     2. Is there a Crystal Report tool to code reports for SAP HANA?

      Could you please give us links to download this tool?


We look forward to hearing from you soon!


SAP HANA Academy: Backup and Recovery - Scheduling Scripts

$
0
0

The SAP HANA Academy has published a new video in the series SAP HANA SPS 7 Backup and Recovery.


Backup and Recovery - Scheduling Scripts | SAP HANA


SAP HANA Studio includes a convenient Backup Wizard to make ad hoc backups, for example, before a system upgrade, or before an overnight large data load. However, for daily scheduled backups in the middle of the night, this wizard is not suitable.


For scheduled backups, there are several options:

  • DBA Planning Calender [transaction DB13] in DBA Cockpit [ transaction DBACOCKPIT ], see SAP Netweaver documentation
  • SAP HANA client-based: hdbsql on a Windows computer using Task Manager. This approach is nicely demonstrated in thisSCN blog by Rajesh
    (please note that a user key should be used in the batch command and never user name with password, as correctly remarked by Lars Breddemann in the commentary)
  • SAP HANA server-based: hdbsql with the Suse Linux crontab.


In this video you can learn how to implement the last option: scheduling scripts using  cron.


Low privileged user


To run scheduled scripts, a dedicated user is created with the BACKUP OPERATOR system privilege. As documented in the SQL Reference, this system privilege only authorizes the use of the BACKUP command and nothing more. The privilege was introduced in SPS 6, and "allows you to implement a finer-grained separation of duties if this is necessary in your organization." (What's New in SAP HANA Platform, Release Notes, p. 41).


Below the script we used to create the user. The default HANA security configuration will require the password to be changed on first logon. As this concerns a technical user with no interactive logon, we have disabled password lifetime. The security requirements of your organization may differ.


create user backup_operator password Initial1;
grant backup operator to backup_operator;
alter user backup_operator disable password lifetime;

The SQL file is attached to this document.


Use User Store Key for save computing


Next, we create a user store key. You should never enter a password on the command line on a Linux system as it will be recorded in the history file. With hdbuserstore you can generate a key to securely store the connection information for a particular system and a particular user. See an early discussion on secure computing with HANA by Lars Breddemann. How to avoid recording passwords to the history file, is discussed in this SUSE conversation.


The -i flag is for interactive. The tool will prompt the user to enter the password. The key can have any name you want. We used a simple key: "backup", as hdbuserstore does not like underscores. Next parameter is the system host name and TCP port. The port is the regular indexserver (SQL) port with format 3 + system instance number + 15. The last parameter is for the user.


hdbuserstore -i SET backup hana:30115 backup_operator

Screen Shot 2014-01-28 at 12.40.13.png

Backup Script


Next step is to create a backup script. You can find several examples in the SAP Notes and by SAP partners:


Unfortunately, the Symantec note and SAP Note 1950261 do not implement hdbuserstore but require a password in the backup script. As discussed, this is not a recommended approach.


SAP Note 1651055  does implement hdbuserstore but then proposes a shell script so sophisticated that it requires the user to have the more powerful BACKUP ADMIN system privileges and not the recommended BACKUP OPERATOR. Or at least, this is my guess - the script contains over 1000 lines of code.

Although the script is extensively documented, unless you are a skilled BASH shell programmer you may be a little challenged here.


In our implementation we have deliberately kept it simple. The script file is attached to this document.


#!/bin/bash
# define backup prefix
TIMESTAMP="$(date +\%F\_%H\%M)"
BACKUP_PREFIX="SCHEDULED"
BACKUP_PREFIX="$BACKUP_PREFIX"_"$TIMESTAMP"
# source HANA environment
. /usr/sap/shared/DB1/HDB01/hdbenv.sh
# execute command with user key
# asynchronous runs job in background and returns prompt
hdbsql -U backup "backup data using file ('$BACKUP_PREFIX') ASYNCHRONOUS"


As recommended by the SAP HANA Administration Guide (p. 286), one needs to use unique name prefixes for each data backup, e.g. a unique timestamp, otherwise, an existing data backup with the same name will be overwritten by the next data backup. In the BASH script we use the Linux shell command date with a certain format mask. The environment is sourced so we do not need to provide the full path to the hdbsql command. You do need to adapt the path to the hdbenv.sh script, of course, unless you install SAP HANA to /usr/sap/shared and choose DB1 as SID.


Note that the procedure documented in the SAP HANA Administration Guide (p. 305), includes the requirement to install the SAP HANA client for hdbuserstore and hdbsql. This section will be updated as the requirement is not correct: any regular SAP HANA appliance installation performed with the Unified Installer (as of SPS 5) or with Lifecycle Manager (since SPS 7)  includes the client;  plus both tools are also part of the server installation (at least as of version SPS 7).


Schedule with cron


Finally, the cron scheduler is discussed. In case you are not familiar with cron, the SLES KB article 3842311 How to schedule scripts or commands with cron on SuSE Linux  or the SLES 11 Administration Guide on the cron package maybe helpful.


Here we have a sample crontab. Syntax is minute, hour, day, month, and day of week, followed by the command.


[ 0 0 * * * ] translates to minute zero, hour zero, any day, any month, any day of week, would result in a daily backup a midnight, while [14 17 17 1 5 ] translates to 5:14 pm on 17-JAN Friday.

Screen Shot 2014-01-28 at 13.37.23.png


As this syntax may be a bit obscure for the non-initiated, SLES also provides a convenient way to schedule hourly, daily, weekly or monthly scripts: just drop the script in the appropriate directory!

This provides no control on the time of execution for the end-user, although the system administrator could specify exact times (using crontab, yes).


Screen Shot 2014-01-28 at 13.39.51.png


Another advantage of using the cron.daily approach could be that you do not need to know how to work with editors like VI on Linux. Just write your backup script on a WIndows computer in Notepad and transfer the script using FTP, WinSCP, or the file copy tool of your liking.


Otherwise the default editor on SLES for crontab is VI, so keep your reference at hand:

[ i ] for insert


[ H ] Move one character to the left


[ J ] Move one line down


[ : ] [ w ] to write and [ q ] to quit.


Is the iPhone generation still paying attention ...


SAP HANA Academy

Denys van Kempen

SAP is Fast and Fiorious with SAP HANA

$
0
0

Yesterday SAP had a press conference where they announced some interesting things about how SAP HANA can now be consumed in easier and easier ways.


The key drivers for this seemed to be the reduction in price for hardware that will support HANA – this should be no surprise as this is Moore’s Law in action. To help customers appreciate this and keep them informed about pricing trends SAP has created a space on the SAPHANA.com site to show approximate prices for various hardware configurations which you can see here. To give this some perspective, last year I know that a 256Gb machine cost $100,000 this chart show it available for $11,278 !!


Screen Shot 2014-03-06 at 08.32.20.png


Another change is the pricing model for SAP HANA, we didn’t get details, but the idea is to unbundle all the services that come round the SAP HANA DB so that you can build the platform up of the components that add value to your use-case.


I hope that these two coupled together with help to drop the “entry point” for productive HANA to a level where everyone can start to innovate on top of HANA (I guess SAP do too ).


To further reduce friction in the innovation process SAP announced further improvements to the SAP HANA Marketplace so you can either bring your own licence or pay a subscription. The managed hardware with the entry level 128Gb system costing $1,595 and 1TB costing $6,495 per month. The subscription licence with 2 versions of HANA available – base and platform - range from $4,595 (Base/128Gb) to $83,295 (Platform/1TB).


With both SAP River and SAPUI5/OpenUI5 (the special sauce that powers SAP Fiori) available to build apps on top of this platform SAP hope that the SAP HANA Marketplace will soon be full of innovative partner apps for you to download……the information above certainly removes many of the barriers to entry…..only the hard part of actually being innovate is left. As a proof point SAP announced that the start ups that it has been helping round HANA have already generated in excess of $10 Million in revenue.


Well done to Vishal and the team at SAP who are proving that SAP can be Fast and Fiorious. Also congratulations on the Guinness world record for the largest Data Warehouse and 12.1 PB !!


Finally when is "Help Help me HANA" by the Beach Boy going to be number 1 - I couldn't find it on iTunes or YouTube.

How smart is Smart Data Access on HANA SP7?

$
0
0

Background

We feel SDA has great potential in a number of use cases, however we wanted to see how it would perform when combining local and remote data sources, which is key for any practical use. For this particular blog, I'm using both HANA for Local(BW) & Remote(Sidecar) sandboxes that are both on revision 72, both sitting on the same physical rack but on different servers. I may follow on with a Local HANA & a remote Oracle db if I folks are interested and we can get the drivers to work for connecting to an 11g db.


Setting up SDA

Not going to go over the actual setup in this blog, as it's been well documented on saphana and in other blogs; some I've noted below..


Smart Data Access: Connecting multiple SAP HANA... | SAP HANA

Smart Data Access with HADOOP  HIVE  & IMPALA


To Confirm:

(Local & Remote) are both HANA Rev72


select database_name as remote_db, substr(version,0,7) as remote_db_version from sys.m_database

local_db_revision.PNG||db_revision.PNG


Demo Objective:

Find the Equipment Status from the "CV_EQUIP_GEN_NEW_STATUS" calculation view on HANA Sidecar HT2 (contains SLT replicated tables from ECC) for a small range of Equipment Numbers from the Equipment Master table "/BI0/QEQUIPMENT" in BS1 (BW on HANA).


Step 1: Add Virtual Table


Navigate to _SYS_BIC (where all activated content resides)

Provisioning.PNG

Scroll to find the desired view, right click and Add as Virtual Table.

Virtual_Table.PNG

Create Virtual Table in a local Schema we created for SDA Testing.


SaveVirtualTable.PNG


Let's execute some queries..


Query 1

Query on BS1 to remote calc view through virtual table with some filters added.


select * from "SDA_TEST"."Zhana_CV_EQUIP_GEN_NEW_STATUS" r_cv
where r_cv.equnr like '6XR39%' -- equip range
and r_cv.datbi = '99991231' -- active records only


What's being Passed to the Remote db? You can check using..


  1. Highlighting the Select statement and doing a Explain Plan or Visualize Plan, I'd recommend to a Explain Plan minimum just in case you don't get the remote query you expect, e.g. In this case we want to avoid materializing the entire calc view on the remote db and bringing back the entire result set.
  2. For this demo and what I believe is the most accurate way is to query SQL Cache on the remote database to find the actual sql statement being executed.


There's a lot more fields of interest in m_sql_plan_cache, just selecting a couple of fields for illustration.


select STATEMENT_STRING,TOTAL_CURSOR_DURATION,TOTAL_EXECUTION_TIME,TOTAL_EXECUTION_FETCH_TIME,
TOTAL_PREPARATION_TIME,TOTAL_RESULT_RECORD_COUNT
from m_sql_plan_cache
where upper(statement_string) like '%CV_EQUIP_GEN_NEW_STATUS%'
and user_name = 'SMART_BS1' -- User name from the SDA connection details
order by last_execution_timestamp desc


I'll execute each statement 3 times so we can average these by dividing by 3.

(Note the equipment range record count is 10,224/3 = 3408)


Qry1_results.PNG


This is confirmed by BS1 results window


Statement 'select * from "SDA_TEST"."Zhana_CV_EQUIP_GEN_NEW_STATUS" r_cv where r_cv.equnr like '6XR39%' -- ...'

successfully executed in 481 ms 263 µs  (server processing time: 352 ms 300 µs)

Fetched 3408 row(s) in 2.048 seconds (server processing time: 9 ms 802 µs)


So we can see that the filtering is being successfully passed to the remote query as expected.


Qry1_SQL_String.PNG


Query 2

Query same range, but this time apply filters to local BW equipment master table and join local to remote table in query.


select le.equipment, re.stat
from sapbs1."/BI0/QEQUIPMENT" le, "SDA_TEST"."Zhana_CV_EQUIP_GEN_NEW_STATUS" re
where le.equipment like '6XR39%'
and le.equipment = re.equnr -- inner join on equipment
and le.dateto = '99991231' -- active records only
and re.datbi = '99991231' -- active records only

SQL Plan cache results


Qry2_results.PNG


Statement String,


Qry2_SQL_String.PNG


SDA was smart enough to apply the equipment range filter to the remote calc view, even though I had applied that filter to the local db table.


Query 3

(2 local tables & remote join to Calc View)


Create a local column table and insert the same equipment numbers range as previously used.


create column table sda_test.temp_equip_list (EQUIPMENT NVARCHAR(18) );
insert into sda_test.temp_equip_list
select equipment from sapbs1."/BI0/QEQUIPMENT" where equipment like '6XR39%';

Now include the new column table in the same query.


select lt.equipment, re.stat
from sda_test.temp_equip_list lt, sapbs1."/BI0/QEQUIPMENT" le, "SDA_TEST"."Zhana_CV_EQUIP_GEN_NEW_STATUS" re
where lt.equipment = le.equipment
and le.equipment = re.equnr
and le.dateto = '99991231'
and re.datbi = '99991231'

I was a bit weary of this one, so let's check the explain plan ahead of executing.


Qry3_ExplainPlan.PNG


That's not good, the remote query has lost the crucial equipment filter and is now only filtering out the in-active records. I would have expected some remote cache or remote join type in this scenario. Let's let it roll to confirm..


Query hangs and eventually after a couple of cancel attempts, gives a rollback error on the local db.


Checking the remote to check the damage..

Qry3_results.PNG


Ugghh, not good at all. it bombed after 56million rows, the remote calculation view can return up to 80 million active records. The sql statement string reflects the same as the explain plan above.


Query 4

Let's simplify this a bit, let's just see if having one local table and one remote table helps the remote cache and remote query join kick in. So created a new virtual table called Zhana_EQBS (4 million rows x 12 columns) and join to local sda_test.temp_equip_list (50K rows x 1 column)


select lt.equipment, re.b_werk plant, re.b_lager sloc
from sda_test.temp_equip_list lt, "SDA_TEST"."Zhana_EQBS" re
where lt.equipment = re.equnr


While the response time is quite impressive, all 4 million rows are still fetched from the remote query

(Note, again executed same query 3 times)

Qry4_SQL.PNG

Qry4_SQL_String.PNG


Observations in Summary:

  • So based on the results above, we have to be quite selective on how we use SDA as it comes out of the box in rev 72. It has potential and there may be improvements on the way.
  • I've been able to create a calculation view based on a virtual table and expose it to BW through an external view, but I haven't been able to create a Attribute or Analytical view based on virtual tables as all virtual tables get IS_COLUMN attribute set to false.
  • There's a bug in Studio (again rev 72) where you can't filter on the remote schema/table. It only brings up the local tables, which is quite painful if you have a lot of activated content in _SYS_BIC for example.
  • There are parameters available under configuration that may be able to help, so I'm going to open a message and engage SAP to see if we can improve the efficiency on how smart data access is suppose to work. I'm not sure if statistics have a part to play in the query optimization, but again hoping SAP folks can help out here.

Use Enity's oData created by SAP RIVER in SAP Lumira

$
0
0

SAP RIVER when activated creates tables and oData for the enity. This oData will be used to get the data from SAP HANA into SAP Lumira for preparing dataset. This dataset will be used for Visualization.


Only SAP HANA Analytic Views can be used in SAP Lumira for preparing datasets.

In this blog we will use Enity's oData created by SAP RIVER in SAP Lumira for preparing datasets.


Creating a file with extension .RDL in RIVER environment.


1.jpg


Activate the RIVER file. Now there will be three to ‘Generate Test Data’, ‘Data Preview’, ‘Odata Calls’

2.jpg


Click on Generate test data.


3A.jpg

Specify Sample Data

3B.jpg

I have selected 'values from file'. To look a reasonable data, I have prepared a TEXT file with comma separated.

3C.jpg


Values for YEAR


3D.jpg

Data Preview


3E.jpg

Check the oData by clicking on ‘oData Calls’

4.jpg


Go to SAP Lumira to create a DATASET

5.jpg


Choose SAP HANA database and click on NEXT for establishing a connection

6.jpg


Give the credentials to connect to HANA System and click on ‘Connect’7.jpg


Shortlist the table by using a keyword. Select the columns which are required by checking/unchecking the box. Click on create to create a DATASET.

8.jpg


Click on ‘Prepare’

9.jpg


Prepare the data, Define Measures, Time and Geographic Hierarchy

10C.jpg

Create 'Geographic Hierarchy' for CITY


10A.jpg


Create 'Time Hierarchy' for YEAR

10B.jpg


10D.jpg


Hide the duplicate fields(CITY and other fields) from the dataset panel

11.jpg


Hide the fields which are not required and save the file. You can save it in ‘Local’ or “Cloud’.

12.jpg


Now Click on “Visualize”. Select DONUT CHART for Visualization

13.jpg


Donut Chart - Sales Revenue by City

14.jpg


Donut Chart - Sales Revenue by City – Year on Year by using TRELLIS option

15.jpg


Sources:

SAP HANA Academy | SAP HANA

http://www.saphana.com/community/hana-academy#lumira

Data Modeling in SAP HANA with sample eFashion Database-Part I

$
0
0

1.CREATE eFASHION SCHEMA & TABLES:


  • Launch SQL Editor from HANA Studio.
  • Run SQL Command to create schema.

                        CREATE SCHEMA EFASHION;

  • Run SQL Commands to create tables
    • Six Dimension Tables
    • Two Facts Tables
  • SQL Commands to create tables


    CREATECOLUMNTABLE"EFASHION"."ARTICLE_COLOR_LOOKUP"

    (

      "ARTICLE_COLOR_LOOKUP_ID"INTEGER CS_INT,

            "ARTICLE_ID"INTEGER CS_INT,

      "COLOR_CODE"INTEGER CS_INT,

      "ARTICLE_LABEL"VARCHAR(255),

      "COLOR_LABEL"VARCHAR(255),

      "CATEGORY"VARCHAR(255),

            "SALE_PRICE"DECIMAL(19, 4) CS_FIXED,

            "FAMILY_NAME"VARCHAR(255),

      "FAMILY_CODE"VARCHAR(255)

    ) UNLOAD PRIORITY 5 AUTO MERGE


        CREATECOLUMNTABLE"EFASHION"."ARTICLE_LOOKUP"

    (

      "ARTICLE_ID"INTEGER CS_INT,

            "ARTICLE_LABEL"VARCHAR(100),

            "CATEGORY"VARCHAR(30),

            "SALE_PRICE"DECIMAL(19,4) CS_FIXED,

            "FAMILY_NAME"VARCHAR(30),

            "FAMILY_CODE"VARCHAR(3)

    ) UNLOAD PRIORITY 5 AUTO MERGE


    CREATECOLUMNTABLE"EFASHION"."ARTICLE_LOOKUP_CRITERIA"

    (

      "ARTICLE_LOOKUP_CRITERIA_ID"INTEGER CS_INT,

            "ARTICLE_ID"INTEGER CS_INT,

            "CRITERIA"VARCHAR(5),

            "CRITERIA_TYPE"VARCHAR(5),

            "CRITERIA_TYPE_LABEL"VARCHAR(50),

            "CRITERIA_LABEL"VARCHAR(100)

    ) UNLOAD PRIORITY 5 AUTO MERGE 


    CREATECOLUMNTABLE"EFASHION"."CALENDAR_YEAR_LOOKUP"

    (

  "WEEK_ID"INTEGER CS_INT,

      "WEEK_IN_YEAR"INTEGER CS_INT,

      "YR"VARCHAR(4),

      "FISCAL_PERIOD"VARCHAR(4),

      "YEAR_WEEK"VARCHAR(7),

      "QTR"VARCHAR(1),

      "MONTH_NAME"VARCHAR(15),

      "MTH"INTEGER CS_INT,

      "HOLIDAY_FLAG"VARCHAR(1)

  ) UNLOAD PRIORITY 5 AUTO MERGE


CREATECOLUMNTABLE"EFASHION"."OUTLET_LOOKUP"

  (

  "SHOP_ID"INTEGER CS_INT,

      "SHOP_NAME"VARCHAR(50),

      "ADDRESS_1"VARCHAR(255),

      "MANAGER"VARCHAR(255),

      "DATE_OPEN"VARCHAR(255),

      "LONG_OPENING_HOURS_FLAG"VARCHAR(1),

      "OWNED_OUTRIGHT_FLAG"VARCHAR(1),

      "FLOOR_SPACE"INTEGER CS_INT,

      "ZIP_CODE"INTEGER CS_INT,

      "CITY"VARCHAR(255),

      "STATE"VARCHAR(255)

  ) UNLOAD PRIORITY 5 AUTO MERGE


CREATECOLUMNTABLE"EFASHION"."PRODUCT_PROMOTION"

  (

  "PRODUCT_PROMOTION_FACTS_ID"INTEGER CS_INT,

      "ARTICLE_ID"INTEGER CS_INT,

      "WEEK_ID"INTEGER CS_INT,

      "PROMOTION_ID"INTEGER CS_INT,

      "DURATION"INTEGER CS_INT,

      "PROMOTION_COST"DOUBLE CS_DOUBLE

  ) UNLOAD PRIORITY 5 AUTO MERGE


CREATECOLUMNTABLE"EFASHION"."PROMOTION_LOOKUP"

  (

    "PROMOTION_ID"INTEGER CS_INT,

      "PROMOTION_FLAG"VARCHAR(1),

      "PRINT_FLAG"VARCHAR(1),

      "RADIO_FLAG"VARCHAR(1),

      "TELEVISION_FLAG"VARCHAR(1),

      "DIRECT_MAIL_FLAG"VARCHAR(1)

  ) UNLOAD PRIORITY 5 AUTO MERGE


CREATECOLUMNTABLE"EFASHION"."SHOP_FACTS"

  (

  "SHOP_FACTS_ID"INTEGER CS_INT,

      "ARTICLE_ID"INTEGER CS_INT,

      "COLOR_CODE"INTEGER CS_INT,

      "WEEK_ID"INTEGER CS_INT,

      "SHOP_ID"INTEGER CS_INT,

      "MARGIN"DECIMAL(19,4) CS_FIXED,

      "AMOUNT_SOLD"DECIMAL(19, 4) CS_FIXED,

      "QUANTITY_SOLD"INTEGER CS_INT

  ) UNLOAD PRIORITY 5 AUTO MERGE 


2.LOAD DATA INTO TABLES:


    There are several methods to load data into HANA table. I use flat file using BODS (Business Object Data Services) to load data into HANA tables.


    Load data intoARTICLE_COLOR_LOOKUPtable.


      2.1. Open Business Object Data Service Designer & Create New Project.

      2.2. Create New Job.

      2.3. Create Work Flow.

      2.4. Create Data Flow.

      2.5. Select File Format option from local Object Library.Use flat file option to create file format for source data.

            Set the file format properties,modify fields name and data type.

      2.6. Click on Save.Source of flat file will be created and available in Object Library under Flat File option.

          LOADDATA1.png

    2.7. Create Datastore for target HANA. Import HANA table to datastore.

    2.8. Drag source flat file and target datastore to Data Flow.

          LOADDATA2.png

    2.9. Create mapping query to map source fields to target HANA table fields.

            LOADDATA3.png


  2.10. Validate and Execute Job.(If break point is set execute in debug mode to trace the transformation)

            LOADDATA4.png

    Repeat above steps to load data into remaining tables.

    • ARTICLE_LOOKUP
    • ARTICLE_LOOKUP_CRITERIA
    • CALENDAR_YEAR_LOOKUP
    • OUTLET_LOOKUP
    • PRODUCT_PROMOTION
    • PROMOTION_LOOKUP
    • SHOP_FACTS


  Download DataFile.rar and extract to folder and browse while data load.

     https://sites.google.com/site/journeytosqlserver/DataFile.rar

Viewing all 676 articles
Browse latest View live